


Source: OpenAI, ChatGPT, image generated for the author, October 5, 2026. Prompt: illustrate the distribution of proposed Montana income-tax savings across ten income groups, with the first seven groups receiving 0%, the eighth 2%, the ninth 10%, and the top group 88%.
In September 2026, Governor Gianforte announced the Flat. Fair. Montana. Initiative to promote a flat individual income tax rate of 4.7%.
In this post, I will go over:
- Section 1: What is the proposed 4.7% Flat Tax?
- Section 2: Benchmarking the Projected Economic Impacts.
- Section 3: Broader Implications of the Proposal.
My analysis of the tax cut suggests:
- The proposal would simplify an already straightforward income tax calculation, but would do nothing to reduce the underlying complexity of calculating taxable income.
- Most tax filers would receive little or no direct tax savings, while tax savings would be concentrated among the top 10% of tax filers.
- The projected economic gains depend heavily on the size of the tax cut and the use of relatively large tax multipliers.
- The resulting loss in state revenue would need to be accommodated through lower spending, higher tax revenue elsewhere, or other budget adjustments.
- Montana's 2024 income tax reform was not followed by gains in economic growth or employment relative to its recent performance against neighboring states.
1. What Is the Proposed 4.7% Flat Tax?
Montana currently has a two-tiered individual income tax rate system. The lower-tier rate is 4.7%, and the higher-tier rate is 5.4% for the 2027 tax year, based on the taxable-income thresholds listed below. The proposal urges the Montana Legislature to reduce the higher-tier rate from 5.4% to 4.7% to create a single flat income tax rate.
| Filing Status | 2027 Tax Law | Proposed Flat Tax |
| Single/married filing separately | 4.7% on taxable income up to $65,000; 5.4% above $65,000 |
4.7% on all taxable income |
| Head of household | 4.7% on taxable income up to $97,500; 5.4% above $97,500 |
4.7% on all taxable income |
| Married filing jointly/ surviving spouse | 4.7% on taxable income up to $130,000; 5.4% above $130,000 |
4.7% on all taxable income |
A flat income tax does not mean that everyone pays 4.7% of their income in taxes.
Taxpayers differ in their taxable income, deductions, adjustments, and credits. Thus,
while the statutory marginal tax rate on taxable income would be 4.7%, taxpayers’
effective tax rates—the share of their income paid in state income taxes—would continue
to vary.
The proposal cuts the statutory marginal tax rate from 5.4% to 4.7% for higher taxable
incomes.
1.1 What Does This Tax Cut Mean for Me?
Implementing the tax cut is straightforward: those with higher-tier taxable incomes
would have their tax rate cut by 0.7 percentage points
| Examples of Tax Savings from the Proposed Tax Cut | ||
| Tax Filer | Taxable Income | Tax Savings |
| Single | $60,000 | $0 |
| Single | $100,000 | 0.7% × $35,000 = $245 |
| Married filing jointly | $120,000 | $0 |
| Married filing jointly | $200,000 | 0.7% × $70,000 = $490 |
| Married filing jointly | $1,000,000 | 0.7% × $870,000 = $6,090 |
The table shows a range of tax savings, with some tax filers seeing no savings and
others thousands of dollars.
1.2 Who Receives the Tax Savings?
Using the latest publicly available data on Montana income tax returns and the 2027 statutory income tax brackets, I estimate how the proposed tax cut would be distributed across income groups. The
table shows that direct tax savings would be highly unequal: 70% of tax filers would
receive no tax savings, while the top 10% would receive 88% of total tax savings.
| Distribution of Direct Tax Savings Across Income Groups | |||||
| Income Group | 2023 AGI range (all returns) |
Number of Tax Returns |
Share of Joint Returns |
Share of Tax Savings |
Range of Estimates |
| Lowest 70% | < $65,882 | 430,882 | 6% | 0% | 0% |
| 8th Decile | $65,882 - $83,618 | 61,554 | 26% | 2% | 0.1-4% |
| 9th Decile | $83,619 - $119,541 | 61,555 | 31% | 10% | 6-12% |
| Top 10% | > $119,541 | 61,555 | 36% | 88% | 85-94% |
| Top 1% | > $435,000 | 6,155 | 36% | 46% | 38-52% |
Source: Author's calculations using Montana Department of Revenue Biennial Report (Tax Year 2023, full-year residents).Notes: Shares of joint returns are inferred from DOR's standard-deduction averages (Table 3.15) and scaled so they add up to the
82,989 joint returns reported in Table 3.12. These are static estimatesthat do not account for changes in taxpayer behavior. The top 1% is a subset of the
top 10%.
The typical tax filer would receive no tax savings, while the top 10% of filers would
receive 88%, with nearly half going to the top 1%.
1.3 Why Is the Tax Cut Being Proposed?
- Several states have reduced individual income taxes over the last ten years. Governor Gianforte has said Montana must cut taxes to stay competitive with surrounding states that have lowered income tax rates.
- Governor Gianforte has stated a single rate simplifies the statutory schedule.
- A recent survey indicated that 60% of Montanans said they were concerned about the state’s income tax rate.
- Montana’s General Fund revenue is up 4.1% from FY2025 and is forecast to remain stable or in surplus.
1.4 What Does It Cost the State?
The tax rate reduction would reduce state tax revenue. Three estimates show the proposal's
expected annual cost. This cost represents foregone state revenue—taxes the state
would have collected under current law but that taxpayers would instead retain as
tax savings.
| Source | Estimated Annual Cost |
Share of State Tax Revenue |
Share of Montana's GDP |
| Leg. Fiscal Div. | $130 million | 3% | 0.15% |
| MSPC estimate | $130 million | 3% | 0.15% |
| MSPC dynamic estimate including HB 377 | $192 million | 4% | 0.22% |
| MSPC static estimate including HB 377 | $210 million | 4% | 0.24% |
Notes: Shares are relative to 2025 state tax collections ($4,917M; U.S. Census Bureau) and Montana's Q2 2026 GDP at an annualized rate ($85,988.8M; U.S. Bureau of Economic Analysis). The MSPC estimates are based on the Walczak analysis, Estimated Economic Effects of Montana Adopting a 4.7 Percent Single-Rate Income Tax, which is not publicly available.
The estimates differ mainly because they start from different baselines. The Legislative
Fiscal Division compares the proposed 4.7% rate with current law, including the scheduled
top-rate reduction to 5.4% in 2027. The MSPC dynamic and static estimates start from
the 2026 rate of 5.65%, so they overstate the proposal's cost. The MSPC static estimate
assumes taxpayers do not change their behavior, while the dynamic estimate includes
additional tax revenue from projected economic growth that reduces the overall tax
loss.
For comparison, I calculate these as a percent of state tax revenue and as a share
of the Montana economy. The tax cut costs the state about 3-4% of tax revenue, less
than 0.25% of the Montana economy.
Montana’s main tax revenue sources are property, individual income, and excise taxes,
with about one-third of Montana’s tax revenue raised through income taxes. Lower income taxes will reduce the share of income taxes,
while increasing the share from other sources.
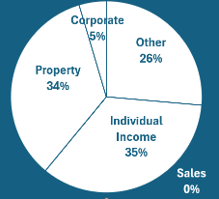
Source: US Census Bureau, Annual Survey of State and Local Government Finances; Tax Foundation calculations. Note: "Other Taxes" include excise taxes (such as those on alcohol,
tobacco, motor vehicles, utilities, and licenses), severance taxes, stock transfer
taxes, estate and gift taxes, and other miscellaneous taxes.
The income tax cut is about 3% of the state’s total tax revenue and will increase
the share of tax revenue from property taxes, corporate taxes, and other taxes.
1.5 How Do Economies Grow from a Tax Cut?
A tax cut may expand the economy. Economic activity increases because individuals'
after-tax income rises, allowing them to spend the additional income on goods and
services, increasing aggregate demand and potentially employment. The tax multiplier
links the size of the tax cut to economic activity:
A tax multiplier is the responsiveness of economic activity to a $1 decrease in taxes;
for example, a tax multiplier of 2.5 means a $1 reduction in taxes generates $2.5
in additional cumulative economic activity.
This equation shows that economic activity increases with:
- The size of the tax cut, since individuals have more after-tax income to spend.
- The tax multiplier, since individuals spend a larger share of their tax savings within the economy.
The tax multiplier is not fixed; its size depends on several factors:
- Type of tax cut: Permanent vs temporary. Temporary tax cuts generate smaller effects because they create less certainty about households’ future after-tax income.
- Who receives the tax cut: Tax cuts directed toward lower-income households have larger effects because these households tend to spend a larger share of their income.
- How households and firms respond: The multiplier is smaller when households save rather than spend their tax savings or when firms do not increase investment or hiring.
- How the tax revenue loss is financed: If the tax cut is offset by reductions in government spending or increases in other taxes, those changes offset the multiplier’s effect.
- Scope of the economy: Multipliers are larger for national economies than for state/local economies because a larger share of additional spending leaks out of a state through purchases of goods and services produced elsewhere.
National evidence generally finds positive tax multipliers, though estimates vary
widely. Ramey (2019) reviews U.S. federal tax multiplier estimates and finds that most empirical estimates
fall between 2 and 3, although some economic models imply multipliers below 1, while
Barro and Redlick (2011) estimate a multiplier of about 1.1. Romer and Romer (2010) estimate that a tax increase equal to 1% of GDP reduces real GDP by approximately
3% after ten quarters, and Mertens and Ravn (2013) find that a one-percentage-point reduction in the average personal income tax rate
raises real GDP per capita by 1.4% initially and 1.8% after three quarters. Household
responses also depend on who receives the tax savings: Johnson, Parker, and Souleles 2006 find that households spent roughly 20–40% of tax rebates in the quarter received
and about two-thirds within six months, with substantially larger responses among
households with low incomes or low liquid wealth. Thus, both the size and distribution
of a tax cut affect its economic impact. Because these estimates are based primarily
on national tax changes, their magnitudes should not be applied directly to Montana.
Lower marginal tax rates affect firm behavior by changing the return to working, investing,
and operating a business. Carroll et al. (2001) find that lower marginal personal income-tax rates are associated with faster sales
revenue growth among sole proprietorships. Giroud and Rauh (2019) find that state personal income-tax rates affect the location of pass-through business
establishments, employment, and capital. Many Montana businesses are taxed under the
individual income tax, so an individual income tax cut is partly a business tax cut.
The magnitude of the employment response also appears to depend on both the size and
distribution of the tax reduction. Zidar (2019) estimates that, following a tax cut equal to 1% of state GDP, tax cuts accruing to
the bottom 90% of earners increase employment growth by 3.4% after two years, compared
with only 0.2% for tax cuts accruing to the top 10%. At the national level, Mertens and Ravn (2013) estimate that a one-percentage-point reduction in the average personal income-tax
rate increases employment per capita by about 0.8% after five quarters. Together,
this evidence suggests that lower marginal tax rates can affect business activity
and employment, but the magnitude of those effects depends importantly on who receives
the tax savings.
Third, lower individual income tax rates can affect investment. Because many Montana
businesses are organized as pass-through entities, whose profits are taxed on their
owners' individual returns, a lower top tax rate raises the after-tax return on some
business investment. The evidence on this channel is more mixed than for business-level
incentives. Studies of targeted business tax incentives, such as bonus depreciation
(Zwick and Mahon (2017)) and corporate rate cuts (Kennedy et al. (2026)), find meaningful investment responses, but 87% of the short-run income gains went
to the top 10% of the earners. When Kansas eliminated state income tax on pass-through
business income in 2012, DeBacker et al. (2019) found that owners reclassified income to take advantage of the exemption, but little
evidence that the reform increased investment or employment. Similarly, Yagan (2015) finds that the 2003 federal cut in the individual dividend tax rate had no detectable
effect on corporate investment.
Lastly, tax rates can affect where high-income households and highly paid workers
choose to live. Moretti and Wilson (2017) find that state personal income taxes influence where highly paid “star scientists”
live, while Rauh and Shyu (2024) find that California’s higher top marginal tax rates increased out-migration among
high-income taxpayers. Drukker (2025) similarly finds that high-income households respond to differences in the effective
price of state and local taxes. Overall, these studies suggest that migration responses
exist but are very small.
Economic activity responds very differently to tax cuts. Debt-financed, permanent
national personal income tax cuts are the most responsive, especially those directed
at lower-income households.
2. Benchmarking the Projected Economic Impacts
The MSPC report projects that a $210 million tax cut would generate:
- $525M increase in the economy;
- 2,445 additional jobs; and
- $642 in additional after-tax income per resident.
I benchmark each projection below.
2.1 Benchmarking the $525 Million Increase in Economic Activity
The MSPC report estimates $525M in additional annual economic activity. This estimate can be reproduced by multiplying MSPC’s tax cut cost estimate of $210M by a 2.5 tax multiplier:

I use estimated tax multipliers to benchmark MSPC's projected economic activity estimate.
As discussed in Section 1.5, tax multipliers estimate cumulative economic activity impacts from national tax changes, mostly deficit-financed, so
we should expect a lower tax multiplier for Montana.
| Cumulative Economic Activity Benchmark Estimates |
|||
| Tax multiplier |
Annual Tax Savings | ||
| $130M | $210M | ||
| No economic effect | 0.0 | $0 | $0 |
| Barro and Redlick (2011) | 1.1 | $143M | $231M |
| Lower end of Ramey (2019) | 2.0 | $260M | $420M |
| MSPC Report | 2.5 | $325M | $525M |
| Upper end of Ramey (2019) | 3.0 | $390M | $630M |
Note: Additional economic activity is calculated as the tax multiplier X annual tax savings.
As shown in the table, using a $130M estimate of tax savings and a tax multiplier
of 1.1 projects a $143 million increase in cumulative economic activity.
The projected $525 million annual increase in economic activity is near the high end
of these national cumulative benchmark calculations. Because state-level multipliers
are smaller than national multipliers, and because annual multipliers are smaller
than cumulative tax multipliers, the projected annual economic impact is likely substantially
lower than $525 million.
2.2 Benchmarking the 2,445 New Jobs
The MSPC report estimates that the new economic activity will create 2,445 jobs.
I benchmark the employment estimate using Zidar (2019). Assuming 12% of the proposed tax savings goes to the bottom 90% and 88% to the top
10%, the tax cut is 0.151% of Montana’s GDP, and that there are 556,400 employed Montanans, the benchmark employment effect is 491 jobs:
![0.151×[(0.034×0.12)+(0.002×0.88)]×556,400=491 "jobs".](/ageconmt/images/flatincometax-equation3.png "0.151×[(0.034×0.12)+(0.002×0.88)]×556,400=491 \"jobs\".")
I additionally benchmark the employment estimate using Mertens and Ravn (2013). A $130M tax cut reduces the average income tax rate by 0.151 percentage points ($130M
/ $86.22B), suggesting a benchmark employment effect of 672 jobs:

Both benchmarks measure effects within two years for the national economy, while the
MSPC projection may reflect a longer horizon, so the comparison is approximate.
Generating 2,445 jobs with the same size of tax cut would require 85% of the proposed
tax savings to go to the bottom 90% and 15% to the top 10%:
![0.151×[(0.034×0.85)+(0.002×0.15)]×556,400=2,445 "jobs".](/ageconmt/images/flatincometax-equation5.png "0.151×[(0.034×0.85)+(0.002×0.15)]×556,400=2,445 \"jobs\".")
The projected estimate is 2,445 new jobs, compared with benchmark national estimates
of 491-672 jobs. Because tax cuts to the top 10% generate little economic activity,
the projected employment gains are likely substantially lower than 2,445.
2.3 Benchmarking the Projected $642 Increase in Annual After-tax Income
The tax cut has been marketed as providing $642 more in annual after-tax income per resident. This estimate can be reproduced by adding the estimated direct tax savings, $210M,
to the projected increase in economic activity, $525M, and dividing by 1.144 million Montanans:
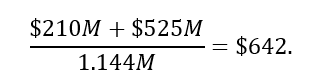
There are three distinct problems with this calculation:
- Incorrect tax baseline: The $210 million tax savings estimate uses the 2026 tax rates rather than the already enacted 2027 rates under HB 337. The proposed 4.7% flat tax would reduce annual revenue by $130 million compared with current law.
- Economic measurement: The calculation equates additional economic activity with additional after-tax income. Not all increases in GDP translate into after-tax income for Montana residents. Some gains accrue to nonresident businesses and individuals, while other GDP components include depreciation and taxes.
- Distribution: The $642 average masks substantial differences in who receives the tax savings and
economic benefits. Approximately 88% of direct tax savings would go to the top 10%
of tax filers, while most filers would receive none. Economic growth would also distribute
any additional income unevenly among workers, business owners, and other residents.
One useful benchmark is the additional after-tax income required to reach $642 annually
per resident. Using a $130 million annual tax cut, the proposal would need to generate
$604.4M in additional annual after-tax income beyond the direct tax savings:

This implies that every $1 in direct tax savings would need to generate an additional
$4.65 in annual after-tax income through economic activity ($604.4M/$130M).
The projected $642 annual increase in after-tax income per resident rests on an overstated
tax-cut baseline and an unsupported conversion of additional GDP into after-tax income.
Achieving $642 would require $4.65 in additional annual after-tax income from economic
activity for every $1 in direct tax savings – an exceptionally large response relative
to estimates of the economic effects of tax cuts. Moreover, the average masks substantial
differences across Montanans, with most direct tax savings accruing to the top 10%
of filers.
2.4 What Happened After Montana’s 2024 Income Tax Reform?
Montana’s 2024 reform, which cut the top individual income tax rate from 6.75% to
5.9%, offers a useful benchmark for the projected effects of the current proposal.
An MSPC analysis argues that Montana’s income tax revenues more than doubled after the
rate cut, but it does not adjust for inflation, includes no comparison with surrounding states,
and covers a period that mostly predates the 2024 cut. A better test is whether Montana’s
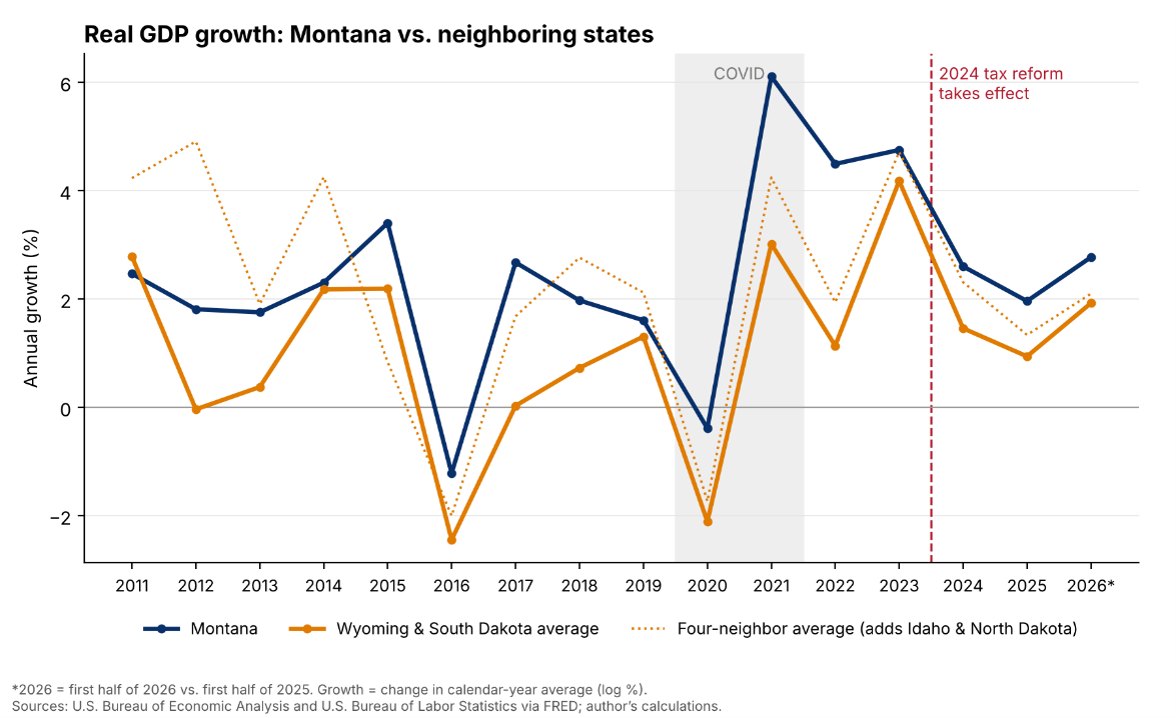
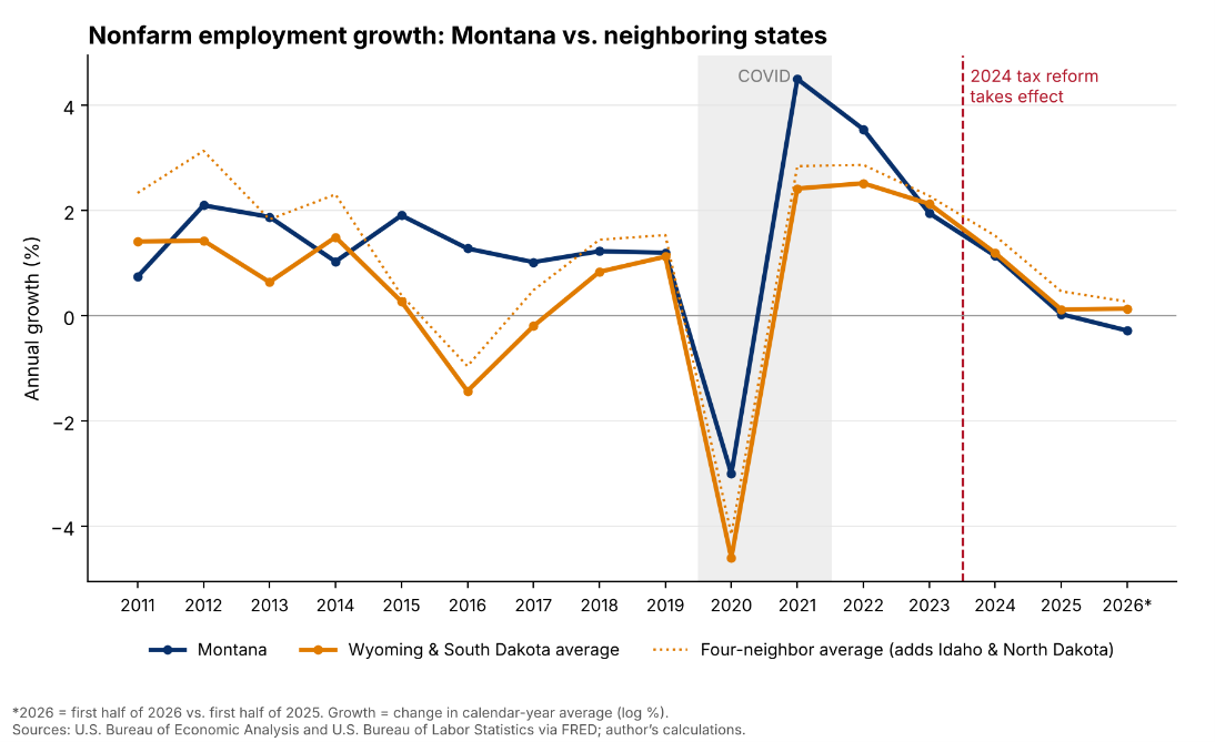
inflation-adjusted GDP and employment grew faster than its neighbors’ after 2024.
I compare Montana with Wyoming and South Dakota. Neither state has an individual income
tax, and both faced many of the same regional and national economic forces as Montana.
I compare Montana’s average annual growth advantage over these states in the two years
after the reform (2024–2025) with its average advantage from 2011 to 2019, before
the pandemic. As a check, I also include Idaho and North Dakota, which cut their own
income taxes during this period; the results are similar.
From 2011 to 2019, Montana’s real GDP grew about 1.9% per year, compared with an average
of 0.8% in Wyoming and South Dakota, a 1.1-percentage-point advantage. In 2024–2025,
Montana’s real GDP grew 2.3% per year, compared with 1.2% in Wyoming and South Dakota,
a 1.1-percentage-point advantage. After the tax reform, Montana continued to outgrow
these states by the same amount.
From 2011 to 2019, Montana’s employment grew about 1.4% per year, compared with 0.6%
in Wyoming and South Dakota, a 0.8-percentage-point advantage. In 2024–2025, Montana’s
employment grew 0.6% per year, compared with 0.7% in Wyoming and South Dakota, about
0.1 percentage points lower. After the reform, Montana’s usual employment advantage
over these states disappeared.
This comparison cannot isolate the causal effect of the 2024 reform. Montana and the
comparison states differ in important ways, other economic conditions changed during
this period, and the 2024 reform changed more than the top marginal rate.
Montana’s 2024 top-rate cut was not followed by faster growth in GDP or employment
relative to neighboring states. This benchmark provides no evidence of a large, readily
observable growth response to top-rate tax cuts.
3. Broader Implications of the Proposal
The economic effects of the proposed tax cut extend beyond the projected changes in
output, employment, and after-tax income. The proposal would also change how the tax
burden is distributed across households, reduce state revenue available for public
spending, and may alter Montana’s relative tax competitiveness. These broader fiscal
and distributional effects matter when evaluating the proposal as a whole.
3.1 Progressivity and Distribution
Economists evaluate a tax's progressivity by comparing the share of income paid in
taxes across income groups. Montana's individual income tax is progressive: higher-income
individuals generally pay a larger share of their income in income taxes. However,
Montana's overall state and local tax system is regressive once you include property,
sales-type, and other taxes. According to the Institute on Taxation and Economic Policy, the lowest-income individuals pay about 9.5% of their income in state and local
taxes, compared with about 6.7% for the highest-income individuals.
The tax cut is heavily concentrated among higher-income filers: 88% of the direct
tax savings would go to the top 10% of tax filers. It would make Montana’s income
tax system less progressive by eliminating the higher marginal tax rate.
The flat income tax proposal would make Montana's individual income tax less progressive
and would make the state rely more heavily on other taxes that are regressive.
3.2 Fiscal Implications and the Balanced-Budget Constraint
The State Constitution requires balanced expenditures, and projected general-fund shortfalls can trigger
spending reductions. The Legislative Fiscal Division's June 2026 budget outlook projects that the 2029 biennium is only narrowly structurally balanced after accounting for baseline, present-law, and anticipated spending pressures. LFD
indicates that adopting a flat 4.7% income tax would “move the structural balance
point into the Pressures level of spending.” The report also notes that additional
known pressures far exceed the remaining structural balance and would push the budget
into structural imbalance, requiring the Legislature to choose between spending and
revenue.
How the economy ultimately accommodates the revenue loss matters. If a tax cut is
later offset by lower government spending or higher taxes elsewhere, those adjustments
can reduce—and potentially offset—the economic gains from the original tax cut.
Kansas illustrates this fiscal risk. Beginning in 2012, the state enacted large income-tax
reductions that produced substantial revenue losses, while the anticipated economic
growth was insufficient to offset them. Budget pressures followed, and the Legislature
reversed much of the tax cut in 2017 (DeBacker et al. 2019; Center on Budget and Policy Priorities). Kansas is not directly comparable to Montana, but it illustrates the risk when
projected growth and revenue feedback fall short.
The economic effect of a state tax cut therefore depends not only on the economic
activity it generates but also on how the state accommodates the resulting revenue
loss and the economic effects of subsequent fiscal adjustments.
Given Montana's projected fiscal position, the state would have to accommodate the
revenue loss through lower spending, additional revenue, use of reserves, or other
budget adjustments. The proposal's overall economic effect therefore depends not only
on the growth generated by the tax cut, but also on the economic consequences of the
fiscal adjustments required to accommodate the resulting revenue loss.
3.3 Tax Competitiveness
The proposal repeatedly emphasizes income tax competitiveness relative to surrounding states. When individuals and businesses decide where to locate,
they consider taxes alongside employment opportunities, housing costs, amenities,
and other state characteristics. The proposed tax cut could therefore increase Montana’s
tax competitiveness and make the state somewhat more attractive to individuals and
businesses.
Two useful ways to compare Montana with other states are tax burden and tax competitiveness.
Tax burden measures how much residents pay in state and local taxes as a share of
personal income, while tax competitiveness indices evaluate the structure of state
tax systems, including tax rates, bases, and other features.
| 2026 State Tax Burden in Mountain States | |||||
| State | Total Tax Burden |
Property Tax |
Individual Income Tax |
Sales & Excise Tax |
Tax Competitiveness Rank |
| South Dakota | 6.4% | 2.3% | 0.0% | 4.1% | 2 |
| Wyoming | 6.7% | 3.4% | 0.0% | 3.3% | 1 |
| Idaho | 7.0% | 1.9% | 1.8% | 3.3% | 9 |
| North Dakota | 7.0% | 2.2% | 0.9% | 3.9% | 11 |
| Montana | 7.3% | 3.0% | 3.1% | 1.2% | 6 |
| Colorado | 7.6% | 2.8% | 1.4% | 3.4% | 33 |
| Nevada | 8.4% | 2.1% | 0.0% | 6.3% | 20 |
| Utah | 8.9% | 2.2% | 2.9% | 3.7% | 15 |
Source: TPC using U.S. Census data and Tax Foundation’s State Tax Competitiveness Index.
TPC estimates that Montana’s total state and local tax burden is 7.3% of personal income.
This is somewhat higher than neighboring states, although lower than other Mountain
West states. At the same time, the Tax Foundation’s State Tax Competitiveness Index ranks Montana #6 nationally overall and #12 for its individual income tax system.
By either measure, Montana is highly competitive.
The proposed 4.7% flat tax would reduce the state’s average individual income tax
rate from 3.1% to 2.9% of personal income (0.031 - $130M / $86.22B). However, the effect on the state’s overall tax competitiveness ranking would likely
be modest because the index evaluates 154 features of state tax systems, not simply
the top marginal income tax rate. Nebraska provides a useful comparison: despite reducing
both its individual and corporate income tax rates, it remained ranked #22 overall.
Montana is already highly competitive on taxes. The proposed 4.7% flat tax is unlikely
to substantially change Montana’s overall tax competitiveness ranking or substantially
increase migration of high-income earners.
The U.S.D.A., Montana State University and Montana State University Extension prohibit
discrimination in all of their programs and activities on the basis of race, color,
national origin, gender, religion, age, disability, political beliefs, sexual orientation
and, marital and family status. Issued in furtherance of cooperative extension work
in agriculture and home economics, acts of May 8 and June 30, 1914, in cooperation
with the USDA, Cody Stone, Director of Extension, Montana State University, Bozeman,
MT 59717.